
8 min read
When COVID-19 appeared, many activities were brought online. This applies to learning – schools and Universities had to find a way to fulfill their task without meeting students in person. Most of them, like the rest of the world, started using videoconference tools like ZOOM, MS Teams or Google Meet. But is teaching this way as effective as the traditional approach?
Declarative studies show that students and lecturers positively assess remote learning, but there is no evidence of the impact of online learning on the objective indicators of visual attention and information processing. It is also not known how social cues (e.g. the faces of other students) during the presentation, lack of eye contact between teacher and students, and cognitive overload caused by looking at the computer screen affect information processing. To evaluate those factors deeper, researchers from the SWPS University and Clemson University conducted an eye-tracking study, using the RealEye software. They wanted to analyze 3 aspects:
In this study, 24 students participated. They calibrated in the eye-tracking software and attended in 15 minutes long online lecture. Students were informed, that they can behave naturally and ask questions. After the lecture, they were asked six questions about the content of the class and to self-report about difficulties experienced during the lecture in three areas: level of concentration, cognitive load, and interaction quality. After the test, participants were divided into two groups: the low score group (11 students with less than 50% good responses) and the high score group (13 students with more than 50% good responses).
The analysis part focused not only on the distribution but also the dynamics of visual attention, which enabled researchers to evaluate students’ attention depth during the lecture. Two types of visual attention can be distinguished: ambient – characterized by short duration fixations followed by long saccades, and focal – long fixations with shorter saccades. The more focal the processing of the stimuli is, the deeper attention is given (indicates active processing of the information). During any visual acquisition task, attention switches between those two types constantly, which is described by a K-coefficient:
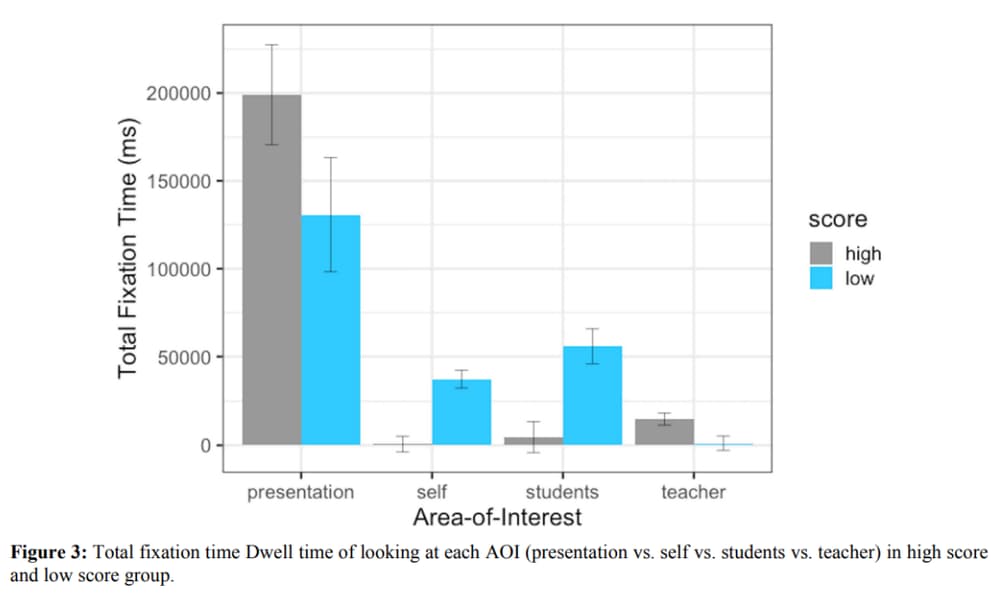
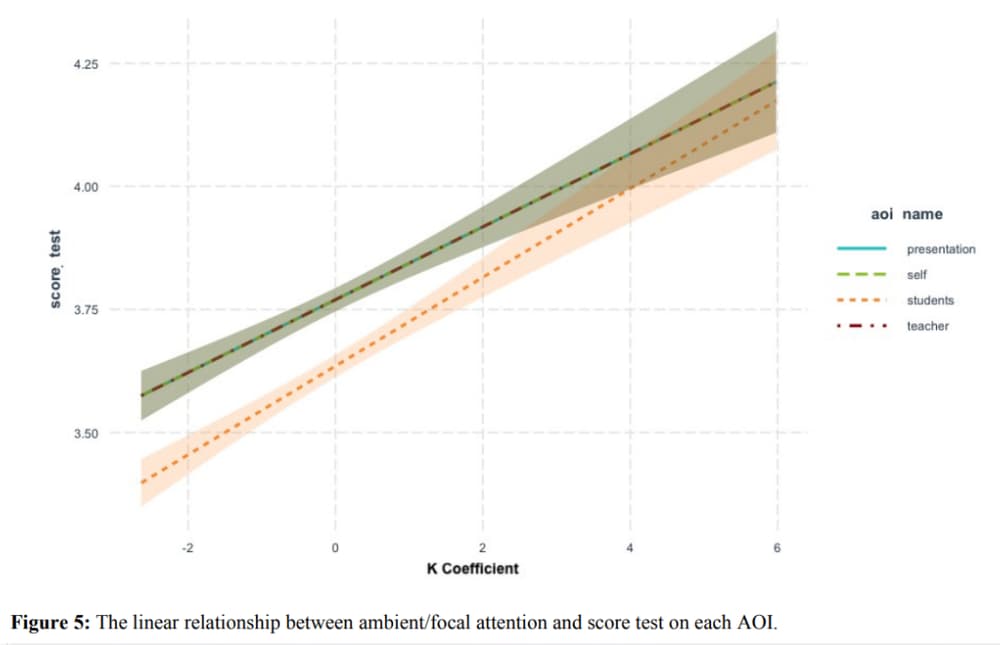
Results were analyzed for four areas of interest (AOI): over the presentation displayed during the lecture, the teacher, each student’s own face (self), and the rest of the students.
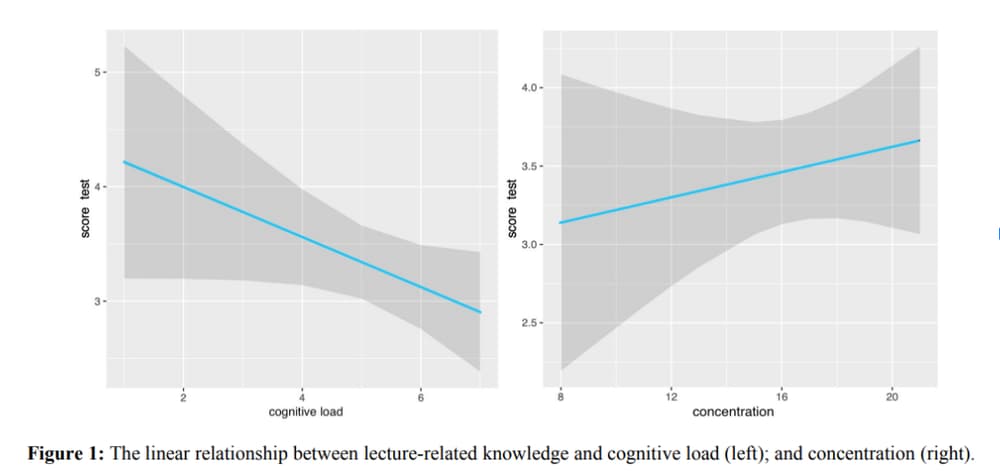
When researchers compared students’ knowledge from the lecture and self-reported measures of concentration, cognitive load, and interaction difficulty they found that cognitive load is negatively related to the task score whereas concentration positively :
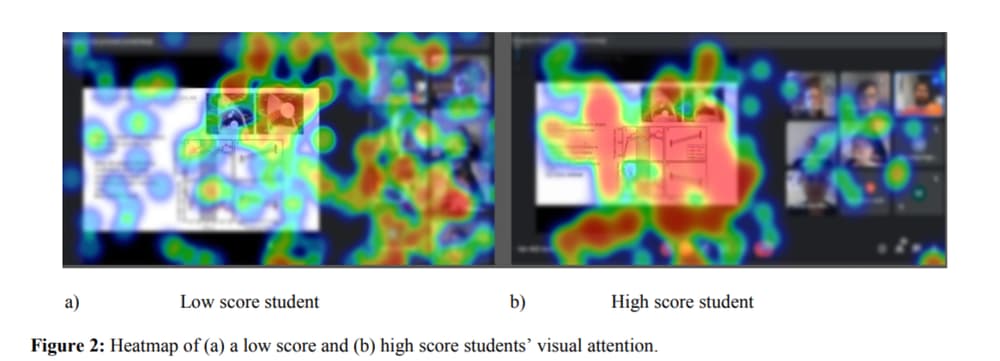
Next, they discovered the difference in the distribution of visual attention on different AOI between students with low and high scores. The high score group spent significantly more time looking at the teacher and significantly less time at themselves, and other students.
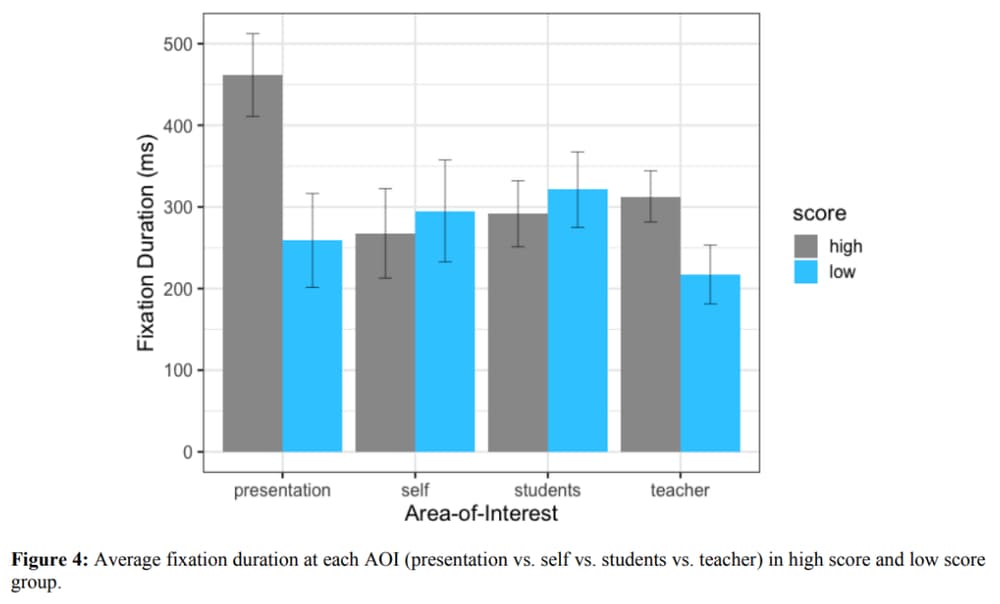
This aspect was also analyzed based on the average fixation duration, which indicates deeper visual processing – it was different between groups only when looking at the area related to the presentation. The high score group had longer fixation duration at the presentation than the low score group.
The last analyzed aspect was the relation between K-coefficient (ambient/focal attention) and test score. The average K value significantly predicted the test score. The more focal attention, the higher score was achieved.
To summarize the results showed that:
Findings from this study can be used in developing real-time alerting systems for teachers, as it may be valuable to observe the level of focal attention during the class to understand the current level of students’ concentration, which can suggest, for example, when to take a break. Results may be also used in the customization of the classroom interface so that students can focus attention on the most relevant information during the online lecture.
Read the full article:
Wisiecka, K., Krejtz, K., Krejtz, I. & Duchowski, A. (2022). Dynamics of visual attention during online lectures – evidence from webcam eye tracking. In T. Bastiaens (Ed.), Proceedings of EdMedia + Innovate Learning (pp. 1220-1230). New York City, NY, United States: Association for the Advancement of Computing in Education (AACE). Retrieved July 8, 2022 from https://www.learntechlib.org/primary/p/221437/.


