Optimizing RealEye Calibration on Computers: Point Count and Accuracy

Martyna Pietrzak
September 24, 2024

How many calibration points are needed for accurate eye-tracking on Computers?

In webcam eye-tracking, accurate calibration is essential for reliable data in research and usability studies. The number of calibration points can influence gaze estimation precision, particularly across different screen areas. To explore this, we analyzed five calibration schemes in RealEye: 5-, 13-, 21-, 39-, and 78- points, evaluating their performance across screen regions and participant data quality. The goal is to find the optimal balance between calibration complexity and accuracy, offering valuable insights for researchers and practitioners.
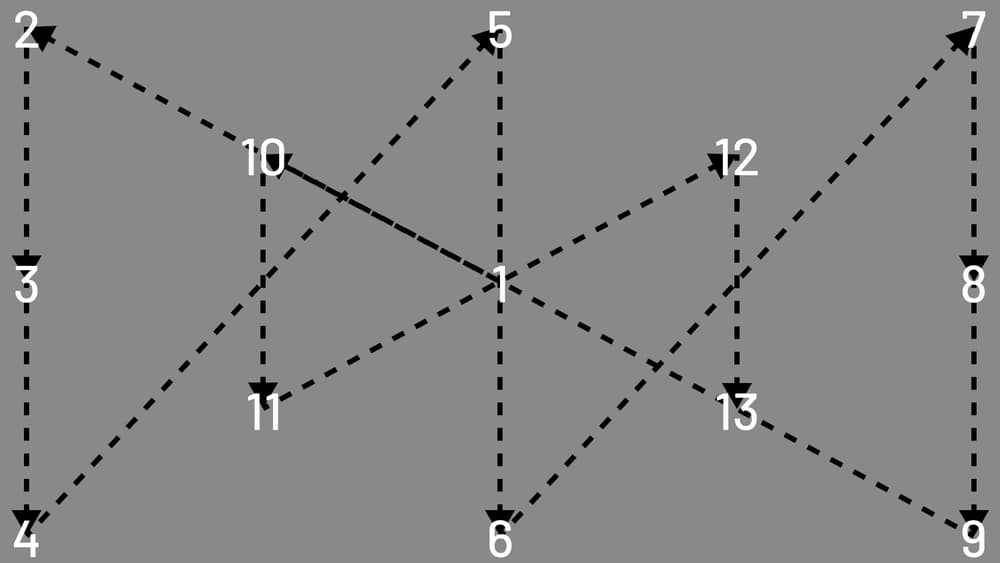
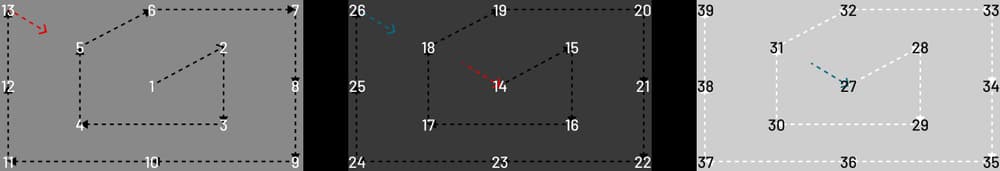
Accuracy by Calibration Schemas

Accuracy and Precision are key metrics used to evaluate how well the eye-tracking system estimates participants' gaze points:

  1. Accuracy [px] – is calculated as the Euclidean distance between the center of the target and the selected fixation.
  2. Precision [px] – is calculated as the standard deviation of the Euclidean distances from the target center to the selected fixations.

RealEye decided to calculate the distances between the center of each target, and the mean of the two most recent fixations that occurred immediately before and/or during the respondent’s click on the target center. These fixations are directly related to the participant's decision-making and task performance. By averaging them, random noise and variability that might be present in a single fixation are reduced, thereby providing a more stable and reliable estimate of where the participant was looking.

Pixels were chosen as an accuracy measurement unit, instead of the more commonly used visual angle, due to the lack of control over participants' distance from the screen and their screen sizes, which are crucial when calculating visual angle. Therefore, using pixels allowed to maintain standard metrics that are independent of these variables, ensuring more consistent and reliable data analysis.
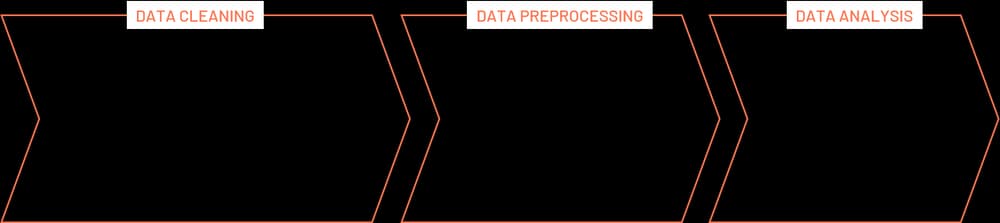
To learn more about RealEye's accuracy methodologies and findings, we invite you to read our Technology White Paper.

The table below summarizes the accuracy results for each calibration schema.

5-point Calibration:

5-point calibration order
  • Accuracy by Screen Area: the accuracy varies across different screen areas, with central regions tending to have better accuracy (of as high as 93 px), while peripheral areas have poorer accuracy (especially bottom corners = 148 and 170 px).
  • Accuracy by Quality Groups: the overall accuracy shows inconsistent performance with an accuracy ranging around 139-153 px across different participant quality groups. However, the small sample sizes (7 to 21 participants per group) limit reliability.
  • Accuracy for at least Good data = 140.54 px (n=17)
  • Implications: this method may lack consistency, making it less suitable for tasks requiring high precision.

13-point Calibration:

13-point calibration order
  • Accuracy by Screen Area: improved accuracy in some areas, deterioration in others compared to the 5-point calibration. Corners however still show significant inaccuracies, with the upper-left area reaching up to 226 px.
  • Accuracy by Quality Groups: improvement compared to the 5-point calibration, with values ranging from 136 to 149 px across different participant quality groups. Important note: small sample size for data quality >= 5 (23 participants).
  • Accuracy for at least Good data = 135.92 px (n=36)
  • Implications: this schema may be suitable for tasks where high precision is not critical, and focused on central screen areas.

21-point Calibration:

21-point calibration order
  • Accuracy by Screen Area: further improvements in accuracy, with values ranging from 69 px in the left side of the screen (which seems to be a little random) to 188 px in the top-left area.
  • Accuracy by Quality Groups: the accuracy improves across all participant groups, with the lowest value being 114 px and the highest at 131 px. Important note: small sample size for data quality >= 5 (13 participants).
  • Accuracy for at least Good data = 114.37 px (n=31)
  • Implications: this schema strikes a semi-good balance between the number of calibration points and the accuracy achieved. This method may be suitable for tasks focused on central screen areas.

39-point Calibration [default]:

39-point calibration order
  • Accuracy by Screen Area: this calibration shows substantial improvements, with accuracy values ranging from 83 px to 154 px. 7 central and upper screen areas exhibit particularly good accuracy, with average value below 100 px.
  • Accuracy by Quality Groups: the accuracy across participants is consistently high, with values ranging from 101 px to 108 px. The difference in accuracy across participant groups is minimal, indicating that this calibration method is robust across a range of participants.
  • Accuracy for at least Good data = 105.80 px (n=83)
  • Implications: this schema provides very good accuracy across most screen areas, making it highly suitable for tasks requiring both central and peripheral accuracy. It is also robust across different data quality groups.

78-point Calibration:

78-point calibration order
  • Accuracy by Screen Area: this calibration offers the highest accuracy among all methods, with values from 85 px to the maximum of 113 px in the top-left area if the screen. This method ensures high accuracy across nearly all screen areas, with particularly strong performance in both central and peripheral regions.
  • Accuracy by Quality Groups: the best among all calibration methods, with values ranging from 69 px to 111 px. Notably, even the worst accuracy result in the 78-point calibration is still better than the best results achieved with the 5-, and 13-point calibration, highlighting its superiority in delivering precise eye-tracking data across all data quality groups. Important note: small sample size for data quality >= 5 (10 participants).
  • Accuracy for at least Good data = 94.86 px (n=33)
  • Implications: this schema is the most accurate and reliable method, making it ideal for tasks that require precise eye-tracking across the entire screen. Its performance justifies the increased complexity and time required for calibration, particularly in scenarios where high accuracy is critical.

Comparative Analysis

Accuracy by Position on the Screen

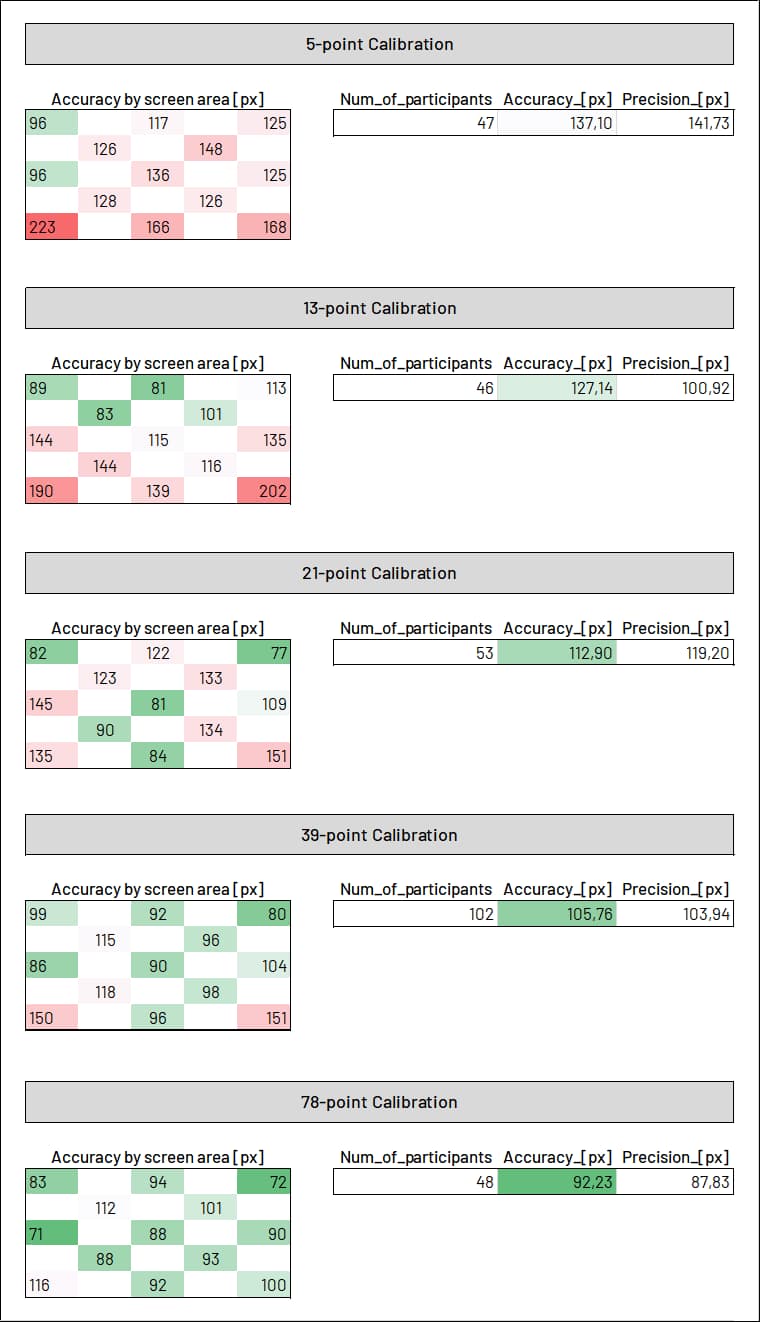
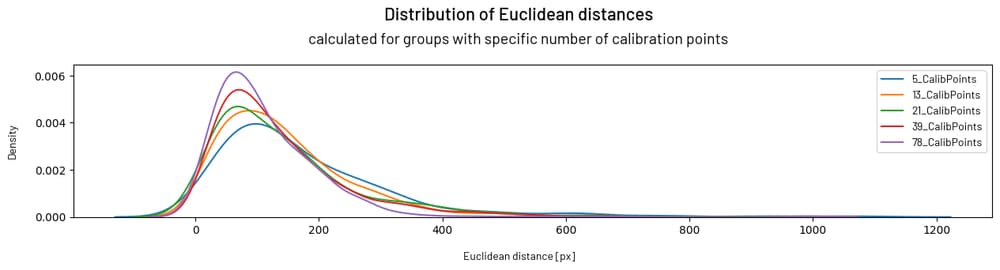
As the number of calibration points increases, the accuracy across the screen areas generally improves as shown in the table above. The 5-point and 13-point calibrations show significant inaccuracies, particularly in peripheral areas. In contrast, the 21-, 39-point and 78-point calibrations achieve much better accuracy across both central and peripheral regions. This trend indicates that increasing the number of calibration points leads to better spatial accuracy.

Accuracy by Data Quality Groups

The comparison can be made for groups ranging from Very Low (1) to Good (4) data quality since the sample sizes for the Very Good (5) quality group are too small to provide reliable insights. In general, accuracy improves as the number of calibration points increases. The most significant gains in accuracy are observed when moving from the 5-point to the 21-point calibration. However, once the calibration reaches 39 points, the rate of improvement slows down, meaning that adding more points beyond this doesn't significantly enhance accuracy. While the 78-point calibration achieves the highest accuracy overall, the small additional benefit compared to the 39-point calibration may not justify the increased complexity and time required in every situation.

Post-hoc Dunn's Test on min Good data quality

The Kolmogorov-Smirnov test for normality was performed on all datasets and indicated that none followed a normal distribution. Therefore, the Kruskal-Wallis H-test was used to compare all groups, as it is non-parametric and can handle groups of different sizes without sensitivity to imbalances. Following this, Dunn's test (with Bonferroni adjusted p-values) was conducted for post-hoc pairwise comparisons.
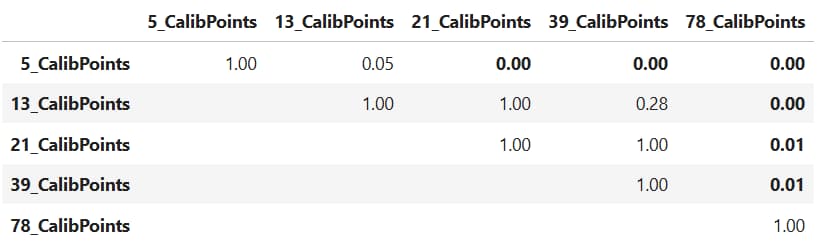
The post-hoc Dunn's test on min Good data quality provides statistically significant differences in accuracy between certain calibration schemas:

  • 5-point and 13-point calibrations show no significant difference between them (p=1.00), but both significantly differ from the 21-, 39-, and 78-point calibrations.
  • 21-point and 39-point calibrations are statistically similar (p=1.00), indicating adding more points from 21 to 39 doesn’t really improve accuracy any further.
  • 39-point and 78-point calibrations are also statistically similar (p=1.00), suggesting that increasing from 39 to 78 points doesn’t provide much additional accuracy benefit.

The lack of significant differences between the 21-, 39-, and 78-point calibration indicates that the 39-point calibration provides a good balance of accuracy and performance consistency across participant groups. This method minimises the variability in accuracy, making them reliable choices for a broad range of applications, enabling efficient calibration without sacrificing accuracy.

Recommendations and Conclusions

  • Task-Specific Calibration: For tasks requiring high accuracy across both central and peripheral areas, the 78-point calibration is recommended, providing unmatched precision despite its complexity.
  • Balanced Calibration: The 39-point calibration strikes an effective compromise between accuracy, complexity, and time efficiency, making it suitable for general-purpose eye-tracking tasks, e.g. in user experience research.
  • Simple and Fast Calibration: The 21-point calibration is ideal for situations prioritizing speed and simplicity, offering reasonable accuracy with less complexity for quick studies.

The analysis shows that increasing the number of calibration points generally leads to better accuracy in eye-tracking data. However, the choice of calibration method should be based on the specific requirements of the task at hand. The 39-point calibration offers a balanced approach, suitable for a wide range of applications, while the 21-point calibration is a more practical option for less demanding tasks. The 78-point calibration provides the highest accuracy and consistency, making it the best choice for tasks requiring precise and reliable data across the entire screen. The 39-point calibration therefore stands out as the best overall choice, offering an optimal balance between accuracy, complexity, and time efficiency. In a variety of eye-tracking tasks, this method consistently delivers strong performance, particularly in user experience research and behavioral studies, where both precision and practicality are crucial.

Other Blog Posts: